After two years of sustained work, we are delighted to share the full report (PDF) from the Museum Closure project, funded by UKRI AHRC. This work was possible thanks to Prof Fiona Candlin’s leadership and the efforts of all colleagues at the Mapping Museums Lab. We are deeply grateful to Lord Mendoza, Chairman of Historic England, for contributing the foreword. Being deemed worthy of a Lord’s attention feels like a distinctly British marker of achievement.
From Lord Mendoza’s preface: “The Mapping Museums Lab is a critical programme for the museum sector. Building on their successful project to compile a dataset of all UK museums since 1960, this comprehensive report provides data on museum closures and collection disposal. It develops our understanding of the reasons behind museum closures and identifies a direction of travel which has implications for our shared heritage in museums and their collections.”
See the data platform, coded by George Wright, at https://mappingmuseums.shinyapps.io/mappingmuseums
The report brings together the unusually rich dataset we collected on museum closures across the UK from 2000 to 2025. I worked especially on the data modelling and the geographical dimension, tracing where losses have been concentrated, how regional patterns differ, and the collection dispersal. A few thoughts on these findings:
Regional contrasts are stark. London gained museums overall, yet simultaneously saw one of the steepest declines in local authority provision, with several boroughs losing all their council-run museums. Scotland experienced the highest number of closures, while Northern Ireland showed the largest proportional growth. Wales saw notable gains too, driven by new independent initiatives.
Urban fortunes diverge. While large metropolitan regions often gained museums in absolute terms, they also experienced some of the most visible losses of medium-sized institutions that once anchored their local cultural life. Smaller towns across the North East, North West and Midlands often faced long-term reductions with few replacements.
The hollowing out of local authority museums is uneven. Ten districts that had council-run museums in 2000 have none today. The shift towards independent and private governance has produced a more uneven national landscape, where museum access increasingly depends on local initiative rather than public provision.
Replacement does not (always) compensate for loss. New museums tend to be small and independently run, clustering in areas with strong volunteer networks or heritage tourism. The closures, by contrast, often involve long-established public museums with broad collections and civic roles.
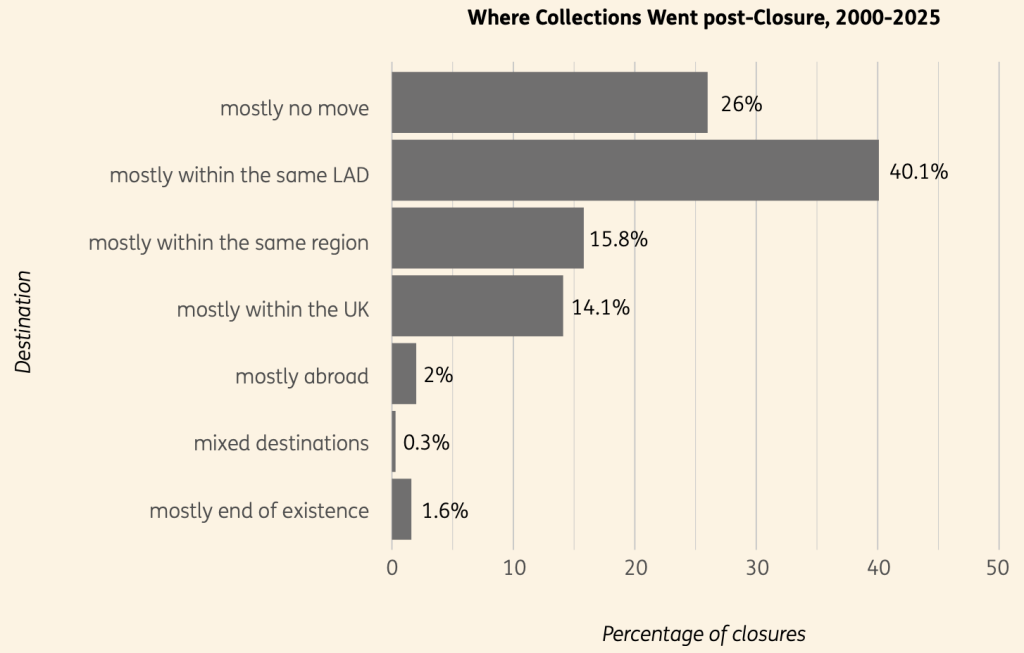
Collection dispersal follows a distance-decay pattern. With the important caveat that tracing collection destinations is not always possible, the data show that more than 60% of collections stay within the same local authority district as the museum that originally held them, as illustrated in the figure below (p. 30 of the report). A further share remains within the same region, meaning that most collections retain a strong geographical link to their local area. Only six collections travelled outside the UK, though more may have been sold to overseas collectors.
📚 Reference: Fiona Candlin, Andrea Ballatore, Mark Liebenrood, Alexandra Poulovassilis, Peter Wood, George Wright, Maria Golovteeva, Helena Bonett (2025) ‘Closed museums and their collections 2000-25: A summary of the data’, Birkbeck, University of London. [pdf]

